
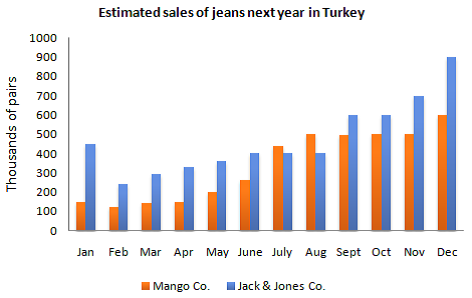
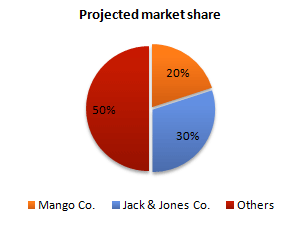
The bar chart below shows the estimated sales of jeans for two companies next year in Turkey. The pie chart shows the projected market share of the two companies in jeans at the end of next year.
Write a short report for a university lecturer describing the information shown below.
The charts illustrate the projection for jeans sales of two companies and their market shares next year in Turkey.
As can be seen in the bar graph, Jack & Jones Co. is expected to sell around 450,000 pairs of jeans in January, but in February, this number plunged to a bottom of around 250,000 pairs before increasing steadily to around 400,000 pairs in June and levelling off till August. After that the sales are projected to rise at different rates to reach all time high of approximately 900,000 pairs of jeans. As regards the sales forecast of Mango, it started much lower than that of Jack and Jones Co. with only about 150,000 pairs of jeans. The figure then will rise to overtake that of Jack & Jones Co. only in two months, July and August, with around 450,000 and 500,000 pairs respectively, but then will stabilize till November before a lift up to about 600,000 pairs.
According to the pie chart, Jack & Jones Co. projected market share is 30 % while that of Mango is 20%, leaving the remaining 50% for other companies.
Overall, sales of both companies are expected to increase next year and they will be best performers in the Turkish jeans market. (207 words)