
The charts below give information about endangered plants around the world. Summarizing the info…
The graphs illustrate the proportion of plant species endangered at different levels and in discrepant habitats world-wide.
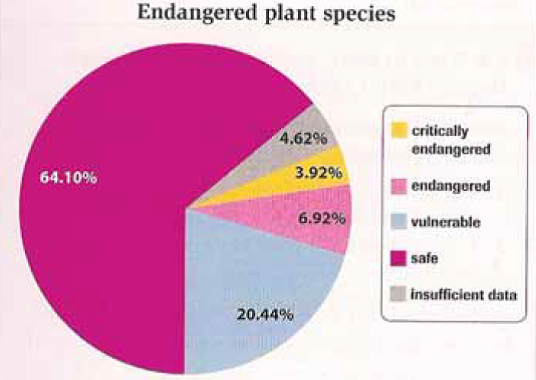
As is shown in the pie chart, the percentage of plant species in the safe zone is 64.1%, and 4.62% do not have sufficient data for classification while the remaining is categorized into three levels of endangerment. The plant species most at risk make up 3.92% , which is a little less than those that do not have sufficient data for categorization. The endangered constitute 6.92% while the figure for vulnerable species is around three times as much, at 20.44%.
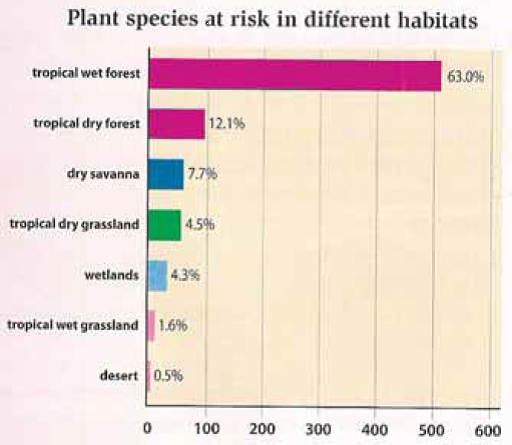
The bar graph indicates that the habitat putting the most jeopardy to plants is tropical wet forest, where 63% of endangered species are located. Tropical dry forest is the second ground posing risk to 12.1% of the total plants. The smallest percentage of plants at risk is recorded for desert, at 0.5% while the figures for other habitats range from 1.6% to 4.5%.
Overall, the plants species at risk amounts to nearly a third of the world fauna, and tropical areas are the susceptible land for the disappearance of the plant species. (189 words)