Đề thi IELTS Writing ngày 25/04/20
TASK 1
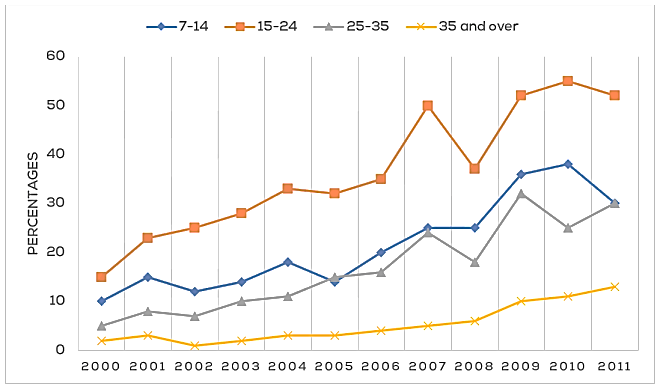
The chart below shows the percentage of people of different age groups who went to cinema once a month or more in one European country from 2000 to 2011. Summarise the information by selecting and reporting the main features, and make comparisons where relevant.