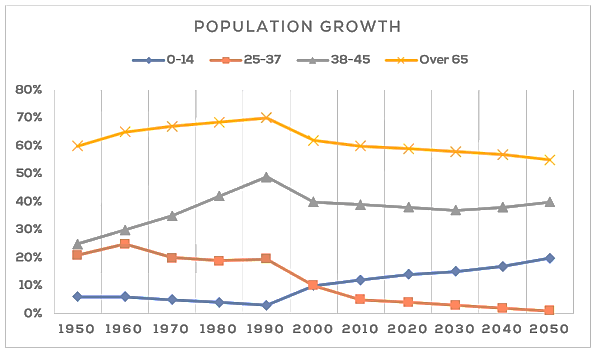
The line graph shows the percentage of New Zealand population from 1950 to 2050. Summarise the information by selecting and reporting the main features, and make comparisons where relevant.
TASK 2
Spoken communication is more powerful than written communication. To what extent do you agree or disagree?