Đề thi IELTS Writing ngày 05/03/20
TASK 1
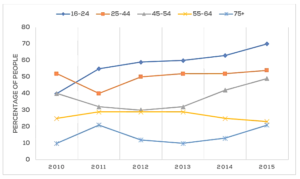
The graph below shows the percentage of people in different age groups in one city who attended music concerts between 2010 and 2015. Summarise the information by selecting and reporting the main features, and make comparisons where relevant.