Đề thi IELTS Writing ngày 01/02/20
TASK 1
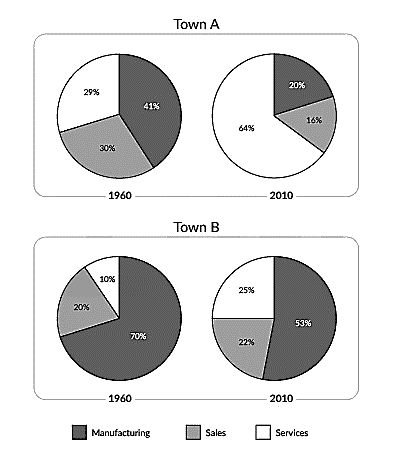
The charts below show the percentage of people working in different sectors in town A and town B in 1960, 2010. Summarise the information by selecting and reporting the main features, and make comparisons where relevant.