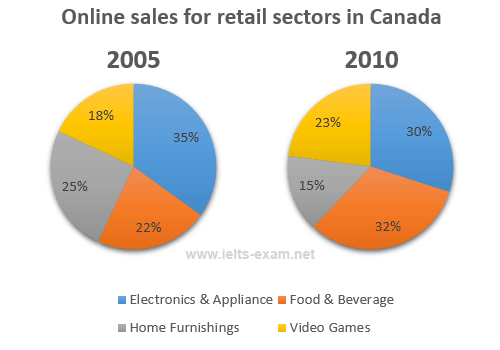
The charts compare four retail sectors in Canada in terms of the proportion of their internet sales in two years, 2005 and 2010.
In 2005, the proportion of online sales of food and beverages was 22%, but this rose to the highest number of 32% in 2010. The percentage for internet sales of video games also went up, by 5% from the 2005 figure of 18%.
In contrast, the percentages of the online sales of the other sectors decreased. The most dramatic fall was in the home furnishings retail sector. While this figure was 25% of the total online sales of these four sectors in 2005, it fell to the lowest proportion of just 15% in 2010. There was also a decrease in the electronics and appliances sector, which saw a fall from the greatest percentage of 35% in 2005 to 30% in 2010.
Overall, the proportion of online sales for each of the four sectors changed significantly from 2005 to 2010. While the figures for food and beverages and also video games increased, the figures for the other two sectors fell. (180 words)