
The graph below shows the number of university graduates in Canada from 1992 to 2007. Summarize the information by selecting and reporting the main features and make comparisons where relevant.
Version 1: Band 7+
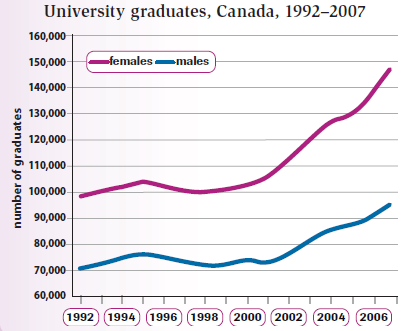
The line graph illustrates the number of the Canadian males and females who finished university education between 1992 and 2007.
As is shown in the graph, graduate numbers rose during the 15 years and reached their highest levels in 2007, but there were always more female than male graduates. In 1992, the difference was less marked with just over 70,000 males and about 100,000 females. However, by 2007 there had been more significant growth in female numbers. That year, they rose to 147,000, compared to just 95,000 males. Thus, the gap between the number of male and female graduates had widened.
Amore detailed look at the graph reveals that the overall growth in numbers was not always steady. Between 1992 and 1995, there was a slight increase. That was followed by a period of about five years when number fell, then flattened out at just over 70,000 for men and 100,000 for women. After 2000, however, graduate numbers saw their strongest growth rate, and this was well above the increases that had been seen in the early 1990s.
Clearly, there were similar trends for male and female graduates over this period, but the number of women graduating increased at a higher rate than the number of men. (207 words)
Version 2: Band 8+
The line graph illustrates the number of the males and females who finished Canadian higher education between 1992 and 2007.
Starting at 70,000 university graduates in 1992, the number of male students escalated steadily to just over 75,000 in 1994 before dropping to just above the departing point in around 1998 and remaining stable until 2001. After that, more male students graduated each year, and by 2007, this population reached 95,000.
As regards female students, they consistently outnumbered the male counterparts in university graduation during the time. In the same pattern with males’ number, beginning at 100,000 graduates, the figure for females finishing university went up to just under 105,000, and then fell back to the starting point. The difference of 30,000 graduates, with females leading the league, remained stable until 2001. Subsequently, female data experienced a faster growth to strike a peak at around 158,000 in 2007, leaving the male figure further behind.
Overall, although a common up-ward trend could be found in the number of male and female university graduates, there was a consistent and increasing predominance of female students eligible for university graduation. (186 words)