Table description 2 – phone production
The table shows the number of mobile phones sold in millions for a period of six years. Summarize the information by selecting and reporting the main features, and make comparisons where relevant.

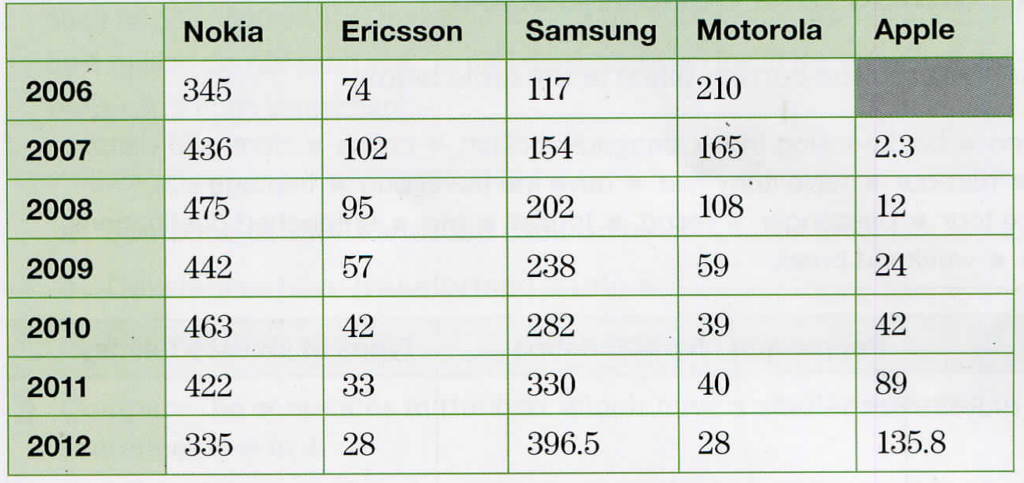
The table compares how many cell phones were sold by five popular brands from 2006 to 2012.
It is clear from the table that Samsung sold only 117 million mobile phones in 2006 which was only around a half of Motorola’s and a third of Nokia’s sales figure. Apple even did not have sales report for that year. Although Samsung continuously thrived in the global market to expand its sales more than three times throughout the period to be the top sought after mobile phone brand in 2012 with 396.5 million phones sold, the fastest development in the market share was claimed by Apple. Indeed Iphone’s sales rocketed by almost 60 times from 2.3 million in 2007 to 135.8 million cell phones in 2012 to make the brand the third best seller.
In contrast, Nokia set off as the predominant player with the highest sales of 345 million phones in 2006, but its figures went through drastic fluctuations to end down at 335 million phones. Also, a downward trend was recorded for Motorolla, and Erricson whose figures were 74 million and 210 million respectively for 2006, dropping nonstop to 28 million, the bottom of the league for both companies in 2007.
In general, while Samsung and Apple experienced success with escalating sales, the other three companies suffered dwindling revenues over the period. (222 words)
