
Line chart 2: Educational level vs salary
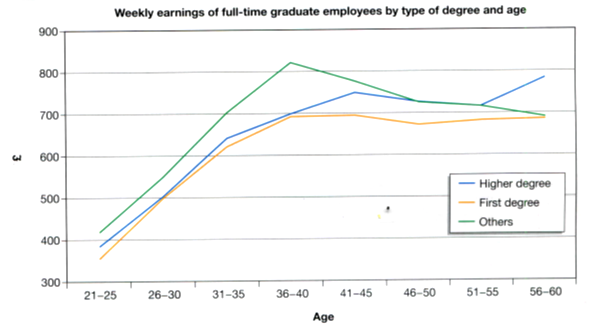
The line graph indicates weekly wage of people with three discrepant academic qualifications in eight age groups in 2002.
In general, people with qualifications other than university degrees earned more than degree holders. Besides, as people moved away from their twenties, they earned more, but their financial yield seemed to start a downward journey from their middle age except for those holding higher degrees.
As is clearly shown in the graph, people possessing other qualifications rather than university degrees or post graduate degrees had the highest income per week from their full-time jobs in most age groups in 2002. It started at around 420 pounds for age 21-25, reached a peak at 820 pounds for those aged 36-40, and then dropped steadily to just under 700 pounds for 56-60 year olds.
As for higher degree holders, their weekly income at the beginning of their career ranked second at almost 390 pounds. This escalated to a peak at 750 for those aged 41-50, and then shared the same downward slope with the earning of people having other qualifications until lifting dramatically from age 51-55 to make a new zenith at nearly 780 pounds for holders of all types of qualifications at age 56-60.
Additionally, being the most modest earners of all age groups wielded with their first degrees, those in the age from 21 to 25 earned only almost 350 pounds. The hike in income of these university graduates almost paralleled that of their post graduate counterparts until the age of 36-40, and then came a slight fall and a recovery in wages for the oldest to approximately 680 pounds. (269 words)