
IELTS Writing Task 1 – Line chart 1 – literacy rates
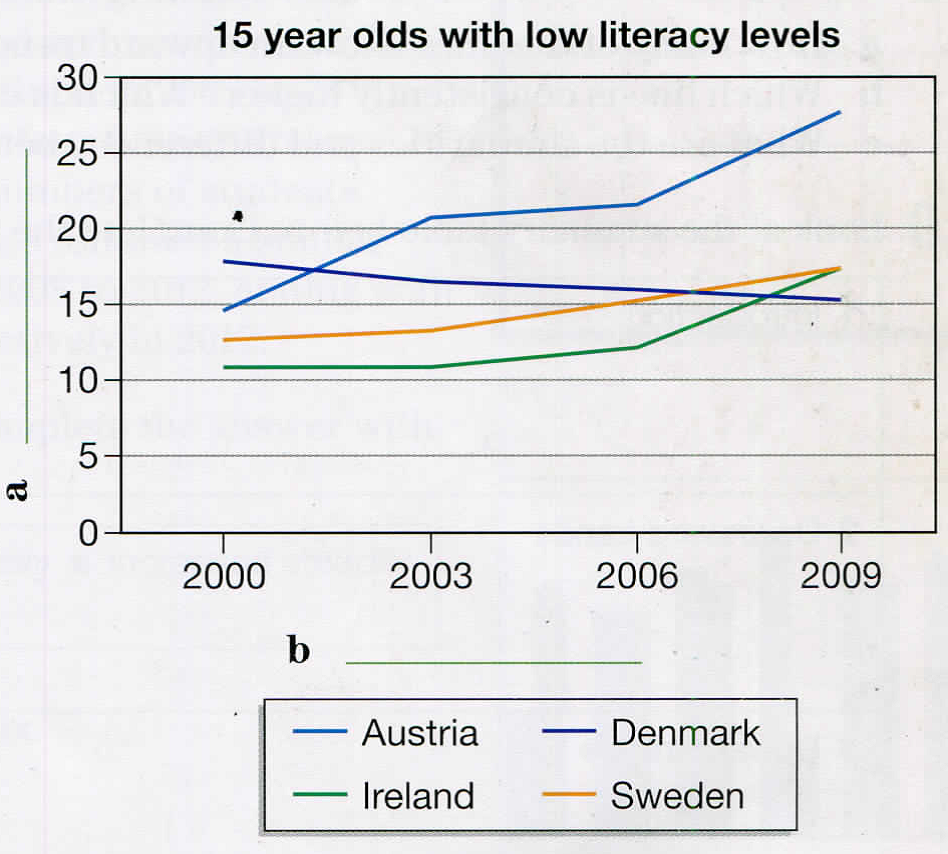
The line graph illustrates the literacy rates of fifteen-year-old people in four European countries from 2000 to 2009.
It is obvious that the percentage of Danish fifteen year olds suffering from low literacy in 2000 was the highest at around 18%. However, this rate gradually dropped to the lowest level among the four countries at 15% in 2009.
On the other hand, Austrian schooling for students degraded quite fast with the figure ranking second at just below 15% in 2000, but then rose at different rates through the years to reach the highest number in all nations at about 27.5% in 2009. The same upward trend was witnessed in Sweden and Ireland, but at a lower speed. Almost 11%, the lowest percentage, of Irish fifteen year olds suffered low literacy in 2000 while the Swedish figure was 12.5%. The rate of Ireland then escalated slowly until 2006 and then more rapidly to reach the same level with the Swedish counterparts at around 17.5% in 2009.
Overall, while people in Denmark improved their low literacy for fifteen year olds throughout the period, those in the other three countries failed to curb the rise of this problem.