
The charts below gives information about tourism in Australia. Select and report the main features and make comparison where relevant.
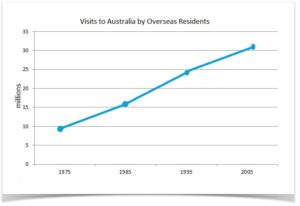
The charts illustrates how many international tourists came to Australia from 1975 to 2005.
As is shown in the line graph, in three decades from 1975 to 2005, the number of visitors to Australia escalated three folds from 10 million to 3 million people from around the world.
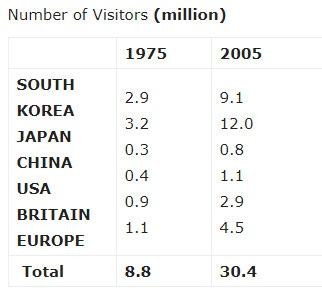
From the table, in 1975, the most tourists setting their feet on Australian soil came from Japan with 3.2 million people, followed by South Korea with 2.9 million visitors, almost ¼ of the total number of visits to the country. In contrast, China sent the most modest number of tourists to Australia (0.3 million, just below the USA (0.4 million. Remarkably, Britain proved to be the main representative from Europe to explore Australia when its number was 0.9 million compared to 1.1 million of the continent.
In 2005, the ranking for the number of visitors to Australia was unchanged with Japan and South Korea still remaining the top two positions with 12 million and 9.1 million visitors respectively. The massive increase in this number was witnessed by every country on the list but the most prominent was seen in Europe whose figure jumped more than four folds to 4.5 million visitors.
Overall, the development of the number of tourist from five countries and Europe to Australia roughly reflected the expansion of the hospitality industry of the oceanic country during the period. (229 words)