An essay of band 6.5
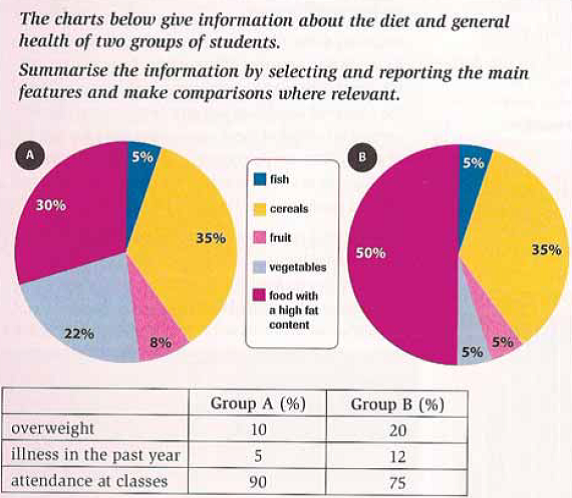
The pie chart provides a breakdown of the types of food eaten by two groups of students, while the table highlights some aspects of their health. The data suggest that diet may have an impact on levels of absenteeism and on students’ ability to stay healthy.
The pie charts show that there are similarities and differences with regard to the two groups’ diets. In both groups, about a third of the food students eat consists of cereals such as pasta, bread, and rice. Similarly, they eat an equal amount of fish (5 percent). However, the proportion of high-fat food eaten by Group B is considerably higher than in Group A, at 50 percent, while students in Group B eat far fewer vegetables than Group A and a slightly smaller quantity of fresh fruit.
The table indicates that there are twice as many overweight people in Group B (20 percent) as in Group A. What is more, Group B has experienced a much higher incidents of illness over the year, with over double the number of students being absent from classes. This has resulted in a 15 percent lower attendance rate. (190 words)
What should be done to improve this essay? –> The overview is unclear, redundancy of vague ideas, some grammatical mistakes of punctuation in complex sentences with “while”, the use of “twice as many people” does not correctly reflect the percentile data, informal language (what is more), incorrect use of number and word (incidents)…